Atom Assignments
Atom Assignment Tables
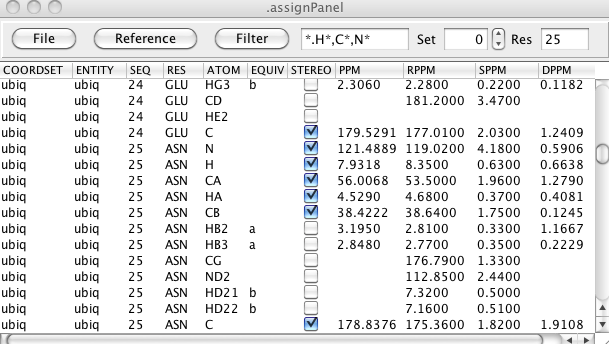
The Assignment table can be displayed by selecting the <span class="menuchoice">Assign > Atoms menu item. It provides a tabular display of the atoms in the current molecule and lets you view and change chemical shift assignments. You can filter the table to show any subset of atoms by atom type and residue range. The table can also be loaded with Reference Information from various sources so you can display the deviation between your shifts and typical shifts for the same atom and residues. NMRVIEW can store and display multiple assignments for each atom, so the table also lets you select which shift set to display.
Menus give you access to functions for evaluating your assignments, reading and writing chemical shift files, generating synthetic peak lists from the assignments and choosing reference data. As with all NMRVIEW tables you can sort the table in any order by values in one or more columns.
The columns..... Editable...
File Menu
- Analyze Shifts
Check Shifts
Display a dialog in which you can display any atom assignments whose chemical shift values deviate from the expected range for an atom of that type by more than a specified amount. The amount (NSigma) is the number of standard deviations away from the mean value for that atom type (means and standard deviations are from the BMRB). The listed of violating atoms can be directed to the NMRVIEW console, or to a file.
LACS Plot
Display a plot for a Linear Analysis of Chemical Shifts. See below for more information and an example.
- Read Chemical Shift Files
Read NvJ PPM
Read a simple text file containing atom names and chemical shift assignments. The file should be in the format written by NMRVIEW and will look like:
     1.CA 54.938 1 1.HA 4.207 1 1.CB 33.248 1 1.HB2
                                            2.082 2 1.CG 30.933 1 1.HG2 1.956 2

The fields are atom specifier (residue.atom), chemical shift,
and stereospecificity code. When you select this menu entry a
file browser will appear with which you can choose the file.
Read PPM From STAR3
Read the chemical shift assignments section of a BMRB STAR version 3 formatted file. If there are multiple assignment sections in the STAR file shifts will be read from the first one.
Read PPM From STAR3 To...
Read the chemical shift assignments section of a BMRB STAR version 3 formatted file. You will be prompted for which assignment section to read from the STAR file (default is 0, the first one in the file). The shift will be stored into the set numbered by the current Set value at the top section of the Assignment table.
Read CYANA PPM...
Read chemical shifts from a file in the format used by the CYANA structure calculation program.
- Write Chemical Shift Files
Write NvJ PPM
Write chemical shifts in simple text file using the NMRVIEW format. The file will be named "ppm.out".
Write NvJ PPM as...
Write chemical shifts in simple text file using the NMRViewJ format. You will be prompted for the file in which to save the assignments.
Write STAR2 PPM...
Write a chemical shift assignment saveframe in an abbreviated STAR Version 2 format. This is the section used for input by some web based programs at NMRFAM (don't ask me why they don't read a whole STAR file, or even a whole save frame).
Write STAR3 PPM...
Write a chemical shift assignment saveframe in STAR version 3 format.
Write Aria PPM...
Write a chemical shift assignment file in the simple text format used by ARIA.
Write Aria XML PPM...
Write a chemical shift assignment file in the XML format used by ARIA.
Write Talos XML PPM...
Write a chemical shift assignment file in the tabular format used by Talos.
Write CYANA PPM...
Write a chemical shift assignment text file in the format used by CYANA.
- Seq Display
Display the Sequence GUI that can be used for doing Chemical Shift Index calculations etc.
- Get Shifts from Peaklists
Get Chemical shifts from a peak list. You'll be prompted with a dialog in which you can specify what list and which dimensions of the list should be extracted. Any peaks with assignments on the specified dimension of the specified list will be used. If more than one peak has the same assignment the values will be averaged. You can specify whether or not to unfold chemical shifts. If specified the peak shift will be checked plus or minus the sweep width. The value most consistent with the atom and residue type will be used.
- Gen PeakList
HSQC
Generate a peak list with two dimensions, corresponding to the amide proton and nitrogen of each assigned residue. You will be prompted for the names of the dimensions to use (these should match those of any dataset you plan on displaying the list with) and which ppm set (default of 0) should be used as the source of the chemical shifts.
Reference Menu
The assignment table has three columns devoted to displaying and comparing chemical shifts with reference values. The RPPM column is the reference chemical shift. The SPPM column is the standard deviation of the reference shift. The DPPM column indicates the deviation of the assigned values (PPM column) from the reference value (RPPM column). The source of the reference shifts and the method of calculating the deviation can be set with the Reference menu.
- BMRB_Avg
Use the average and standard deviation values from the statistics reported by the BMRB.
- RCoil
Use Random Coil values calculated with NMRVIEW from the RefDB database. Standard deviations are taken from the BMRB values.
- Reference Set 1
Use the values loaded into PPM Set 1. Standard deviations are taken from the BMRB values.
- Delta Mode
Abs (delta/sdev)
The deviation value is calculated by dividing the actual deviation between the measured and reference values by the standard deviation and reporting the absolute value.
delta/sdev
Same as above, but do not take the absolute value.
delta
Just use the deviation, without scaling by the standard deviation.
You can display a subset of the assignments by setting a filter for the atom and residue. There are predefined filters available from the Filter menu or you can simply type in values into the entry next to the menu. You can use wild cards (*.ca, *.c*), coma separated lists (*.ca,n,c) and residue ranges (32-40.ca) and various combinations of these styles.
NMRVIEW can store multiple assignment sets for the molecule in memory. You can use this spin box to select which set to display and edit.
Enter a residue number and hit Enter to jump the display to show that residue. This doesn't change the filtering, but rather scrolls the table so that the atoms of that residue is visible.
LACS Plot
The Linear Analysis of Chemical Shifts is a graphical way of examining chemical shift assignments. For details see the original publication (Journal of Biomolecular NMR (2005) 32: 13–22 ). Note that the robust fitting method used by NMRVIEW is not the same as that used by the authors of the original publication, and we have independently calculated slopes of the lines to be used in fitting the different atom types. Because of this the results calculated here, and those calculated at the LACS web site may differ.
When you first display the interface the current assignments will be used to calculate a LACS plot of the CA shifts. The two blue lines will indicate the best fit (using a robust fitting technique) to the data using lines of pre-calculated slopes. The ordinate value of these lines at an abscissa value of 0.0 will be displayed as the Offset, and should be near 0.0 if your data is correctly referenced. Click on the atom selectors (CA,CB, C, HA) to calculate the LACS plot for various nuclei.
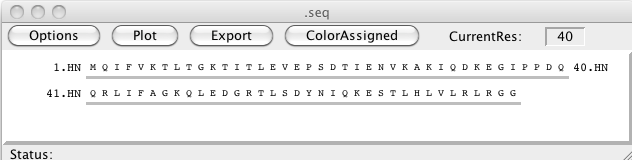
Sequence Display and CSI Analysis
The sequence display window has a graphical view of the molecular sequence and provides tools for showing atom assignments, Chemical Shift Index analysis, and structural cartoons. You can display it by selecting the menu item.
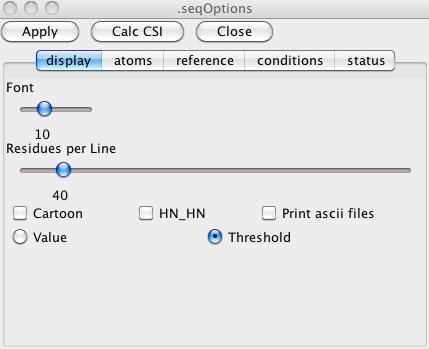
To change the settings of the sequence display window click on the Options button to get the following window. The Options window allows the user to change the various display parameters such as the font size, the atom types that will be displayed, the number of residues displayed on each line, various annotations and to control options used in doing the CSI calculations.
Atom Assignments
The Atoms tab of the Options window lets you control what atoms are displayed. This can be useful for checking the completeness of your assignments. Here we've turned on the display of all the available atoms. Clicking the Apply button is necessary for the display to be updated with the new set of display atoms.Clicking the Color Assigned button at the top of the sequence display window will now color atoms red if they have a chemical shift assignment, and black if they don't. Here's an example with fairly complete assignments done.
Chemical Shift Index (CSI) Calculation
The Chemical Shift Index is a measure of the deviation of the actual chemical shift assigned to an atom, and a random coil (or other standard) value for an atom of the same type and residue. Since the sign and magnitude of these deviations correlate with the secondary structure type that the residue is found in, this provides a way to get a measure of the secondary structure profile of the molecule from just the chemical shift assignments.
The first step of doing a CSI calculation is determining which atom types are going to be used in the calculation, and displayed in the graphical viewer. You can set this in the CSI Calc and CSI Display rows of the Atoms tab. More then one type of atom may be selected for the calculation of the CSI and for displaying the results. It is also possible to calculate the CSI of more then one atom type and display the result of only one atom type at a time. The result of the CSI calculation can be displayed using the actual differences in ppm by selecting the Value checkbox in the Display tab. Selecting Threshold will show the results using the index values +1, 0 and -1. In both cases a positive value/threshold will be red, a negative value/threshold will be blue and a zero value/threshold will be gray. After selecting the settings click on the Apply button. This will update the sequence display window (see figure 5 ).
Proper calculation of the CSI values requires choosing appropriate reference data and solvent conditions. Thanks to various user contributions, NMRVIEW includes a variety of reference datasets representing values collected under different conditions, including denaturants. You can select the Reference dataset in the Reference tab. Clicking the Infobutton will bring up a new window with some information about the selected database
In the Reference tab you can also select which Chemical Shift Reference compound (DSS, TMS, etc.) was used when collecting and assigning your datasets. If the standard used in the experiments differs from the standard used to obtain the values of the database the CSI program will automatically include a correction factor if necessary.
The next tab, Conditions, can be used to enter the information about the pH and temperature used to obtain the chemical shifts. If the data was obtained using deuterated protein and the chemical shift data has not been corrected select the Deuterated Protein option and the CSI program will correct the carbon chemical shift data automatically. The last set of parameters refer to special experimental conditions which may have an effect on the observed chemical shift. The CSI program can correct for the effect of cosolvents like TFE, acetonitril, urea or guanidinium HCL on the chemical shift assuming a linear correlation for the correction factor in relation to the concentration of the cosolvent. When the chemical shifts are obtained using the TROSY experiments and the experimental chemical shifts have not been corrected the CSI program will correct for this when the TROSY options is selected. The CSI may also be used to check the assignments. The CSI program will check the assignments within a certain tolerance if the Check Assignment option is selected. The tolerance is calculated using the cutoff value used in the selected database multiplied by a value which is set by the user.
When all parameters are set click on the Calc CSI button to start the CSI calculations. The results will be shown automatically in the sequence display window using the settings selected in the Option window. In this figure the HA, CA, CB and C atoms are used for both CSI calculation and display, and the secondary structure cartoon is turned on. Since Threshold mode is on, the graphical CSI display of circles shows red circles at the top (for shifts consistent with helical structure, blue circles at the bottom (for shifts consistent with sheet structure, and gray circles at the center (for intermediary shifts) of the plot range. The coloring of the top CON row of atoms is by the secondary structure prediction based on the consensus of all the atom types, and with contributions over a three (sheets) or four (helices) residue window. The cartoon display showing sheet or helical regions is based on the filtered, consensus CSI values.
When the Value, rather than Threshold setting is turned on the displayed circles are plotted relative to the maximum absolute delta for that atom type in the current data. In this case, be aware that some atom types (e.g. CB) will have their shifts going in the opposite direction to the way they move in Threshold mode.
If the "Print ascii files" option is selected in the Options window the following files will be created in the directory where NMRVIEW has been started. ATOMTYPE.csi.REF : file containing the data for the CSI per residue. ATOMTYPE.ppm.REF: file containing the difference (in ppm) between the chemical shift data and the random coil values per residue. ATOMTYPE.csi.as.REF: file containing the observed chemical shifts per residue and a flag indicating if the values are within the assignment tolerance (0) or outside the assignment tolerance (1) or no assignment tolerance was selected (-1). consensus.txt: Only when three or more different atom types are used in the CSI calculation will this file be created. It contains information about the consensus secondary structure elements between the different selected atom types.