Strip Plots
Strip Plot Overview
A fact about NMR data is that the significant signals can exist in a vast emptiness of noise. Peak picking routines can extract this information into a concentrated set of numerical values, but it remains valuable to have a visual way to represent the essence of the data sets. One way to attain this is to render the data in a series of narrow strips, the coordinates of which are chosen to select only regions of the data that contain signals.
Typically the coordinates for a particular strip are chosen based on the chemical shift values of an individual peak in a peak list obtained by the peak picking procedure. The coordinates along the x axis are chosen to center the peak in the strip, which generally has a predefined width. The y axis coordinates are generally the full plot limits along the corresponding dimension of the spectrum, though a more narrow range may sometimes be chosen. If the strip has more than two dimensions, then the strip is drawn at the dataset planes closest to the chemical shifts of these additional dimensions.
An issue more complicated than establishing the coordinates of the strips, is deciding what order the strips should be drawn in. The simplest procedure is simply to draw them in order of the peaks in the peak list. Generally this results in strips that are ordered by chemical shift value. Often, however, it is more useful to draw the peaks in an order which places related strips adjacent to each other. For example, in an HNCA experiment strips derived from sequential residues might have peaks with the same carbon chemical shifts, and this can be visually displayed if the peaks are drawn with carbon chemical shifts along the y axis of the strip.
This is often more clearly shown, if the strips are alternately chosen from two different, but complementary, datasets. For example, by alternately displaying the HNCA and HNCOCA experiment, the overlap of the CA chemical shift as derived from the intra-residue HNCA, and the inter-residue HNCOCA experiment can be displayed. Sequential connectivities could also be visualized by alternately displaying a TOCSY and NOESY experiment.
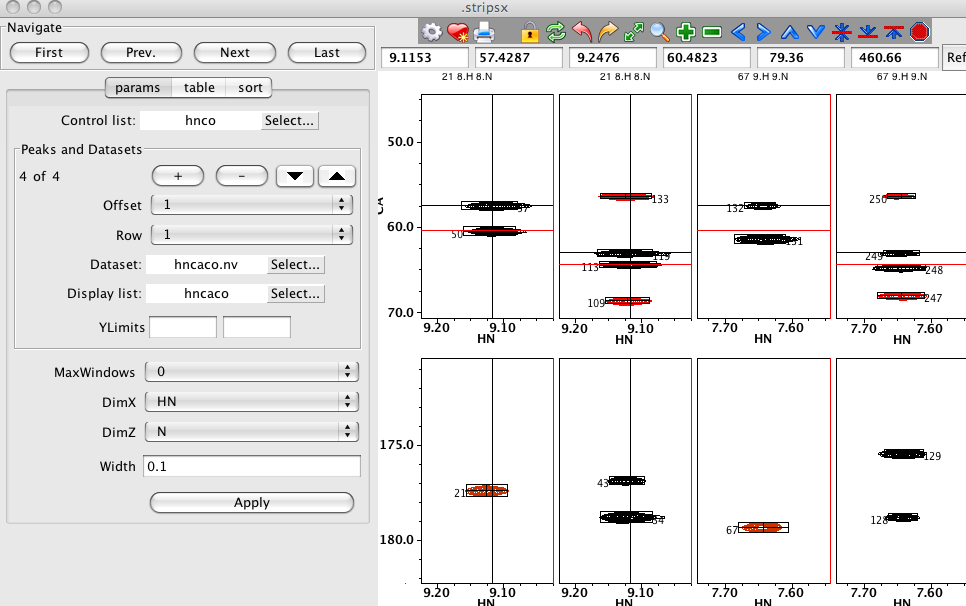
It should be noted that NMRViewJ provides powerful features for coordinated analysis of spectra with its RunAbout tool (see below), but if one wants to set up an explicit display of a series of strips of one or more datasets as described here, the Strips tool is appropriate. The Strips tool allows for an unlimited number of datasets to be displayed with varying offsets and rows. In this example the Strips Tool is used so that HNCA and HNCACB datasets are displayed in alternate columns of the first row, and HNCO and HNCACO datasets in alternate columns of the second row.
Strip Plot Configuration
You can have multiple Strip Plot windows active at one time. First select the menu item to display an interface from which you can choose a name for the strip window. After setting the window name and clicking Create you'll get the Strips Window. The Strip Plot GUI automatically generates strip plots from datasets based on the positions of a series of specified peaks.
The Params area of the window is used to specify which datasets and peaks should be used along with several other parameters that determine how the spectrum strips are displayed. Multiple datasets and peak lists can be displayed in the Strip Plot GUI. Each associated pair of dataset and peak list are referred to here as a dataset/peak pair. Regardless of how many dataset/peak pairs are chosen for display, the user must choose a single peaklist to be the Control List. The chemical shifts of the peaks in the Control List are used to determine the display region for each of the individual strip windows.
When only a single dataset/peak pair is to be drawn, the Offset and Row parameters (see below) should be left at the default values of 0. When the Control List is selected, the Display List for the first dataset/peak pair will be set to the same list. The Dataset for this pair will be set to the dataset associated with this particular peak list. If a different dataset and/or peak list is desired use the Select... buttons to bring up a menu of possible choices for these parameters. The dataset used for the display doesn't need to be that from which the peak was originally picked. It is possible to use a peaklist picked in a spectrum different from that used as the dataset in the Strip Plot. The only thing to take into account is that the names of the labels in the peaklist are identical to those used in the dataset and the dataset must be loaded into NMRView prior to starting the Strip Plot tool.
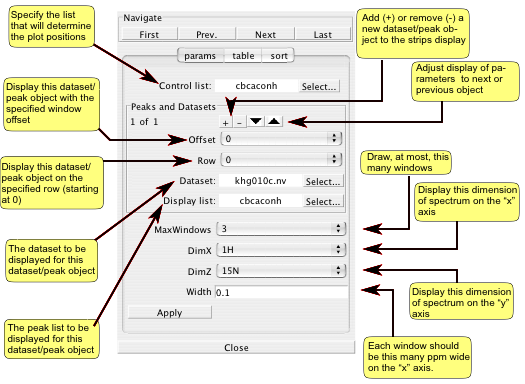
When more than one set of dataset/peak pairs are to be displayed, the Offset and Row parameters are used to determine in which window strips the data will be displayed. For example, if two dataset/peak pairs are to be drawn and the first one has an Offset of 0, and the second an Offset of 1, the pairs will be drawn in alternating windows. The first dataset/peak pair will appear in windows 0,2,4,... and the second in windows 1,3,5,...
For each additional dataset/peak pair to be displayed click the +. The display area right below the Peaks and Datasets label will show which set is currently displayed and how many sets are available. Click the up/down arrows to advance through the sets. Move to each set and set the Offset, Row, Dataset and Display List as desired. You can remove a dataset/peak pair by clicking the - button.
The maximum number of window strips that are displayed is specified with the MaxWindows parameter. If 0 is specified for this parameter, then the maximum number of windows will be automatically calculated based on the size (in pixels) of the window display area. The X axis limits for each spectral display will be centered on the peak position, with a width equal to a value specified by the Width parameter (0.1 ppm by default). The Y axis limits are set by default to the maximum value for the dataset. You You can enter values in to the YLimits entries to specify a smaller range if desired. Each row of windows can have its values for the Y axis limits.
Use the DimX and DimZ controls to set up which dataset dimensions will appear on the X axis and Z plane (for 3D datasets). The remaining dimension will appear on the Y axis. Because the symbolic name of the dimension is used, rather than the sequential dimension, you can use datasets collected with different dimension orders. The plot limits for the X axis of the spectra are set with the Width parameter which specifies the half-width of the window (in PPM).
Click the Apply button to configure all the spectra. If peak entries for the control list have not been loaded into the Peak table (see below) all peaks in the peak list will be loaded.
Strip Plot Peaks
The regions displayed in each window of the strip plot are determined by the chemical shift positions of the peaks in the Control List (as specified above). The actual order of peaks used is determined by their order in the Peak Table area of the Strips Tool. If this table is empty (as it will be when the Strips Tool is first deployed), then when you click the Apply button it will be filled with all the peaks from the control list, in increasing order of their identifier number. There are several ways to explicitly populate the table with peak entries.
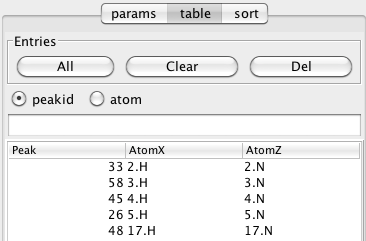
Clicking the All button will load the table with all the peaks from the Control list if the peakid checkbutton is selected, or all the peaks from the Control list that have atom specifiers in their label fields if the atom checkbutton is selected. Alternatively, you can add a specific set of peaks by typing a list of peak identifiers into the field located just above the table, and hitting the Enter key (if the table is already loaded with all the peaks, you'll want to click the Clear button to remove all the table entries first). Peaks should be entered as a space separated list ("3 4 5") and can include peak ranges ("3-10 15-20"). After loading peaks into the table it is a good idea to hit the First button in the Navigate section in order to update the actual display of windows.
The buttons in the Navigate section of the Strips Tool let you change which peak is positioned in the first column of windows. Clicking First will set it to be the first peak in the table, and clicking Last will change the display so the last peak entry is in the last column. Prev. and Next will increment the display backwards and forwards through the list of peaks.
You can change the ordering of peaks in the windows, by changing the order of the table. The simplest way to do this is to sort the table based on the values in any of the columns. Just click on the column header, as is done with any table within NMRViewJ. After sorting refresh the display with the First button. You can also interactively rearrange the table by choosing a row, and with the left mouse button held down, dragging it to a new position in the table. As soon as you release the mouse the spectrum display windows will be updated with the new positioning. Individual rows can be removed from the table by selecting them and then clicking the Del button in the Entries section.
You can also use the Strips Tool to display a fragment generated in the RunAbout tool. Each fragment in RunAbout is a series of clusters of peaks that are linked together, with each cluster containing one peak from a specified Reference List. First, set up the Strips Tool so that the RunAbout Reference list is the Control list in the Strips tool and choose the appropriate other datasets and peak lists. Then, instead of entering one or more peak numbers in the peak entry area, enter a cluster number with a suffix of "f". Thus if you want to display the fragment that includes (anywhere within it) cluster number "45", just enter "45f", and hit the Enter key. The table will now be populated with the list of reference peak numbers in the order they appear in the fragment containing cluster 45. Remember that cluster numbers are actually the peak identifier number of the reference peak contained in the cluster. You can specify multiple values (45f 52f) and combine cluster numbers and peak numbers. For example, "45f 32", would add all the reference peaks in the fragment containing reference peak 45, followed by reference peak 32.
Sort Mode
The sorting mode was devised as a way to aid in building up fragments of sequential peaks. For uses such as assigning triple resonance backbone experiments it is largely superseded by the RunAbout tool which is generally more automated and provides much more information about the quality of matches. But it is still useful in some applications.
The basic idea of this mode is to provide a way to select one strip out of the series, and then use various alternative peak positions to update the display of that strip. This allows you to visually step through various candidate strips to find the best one that matches at the current location.
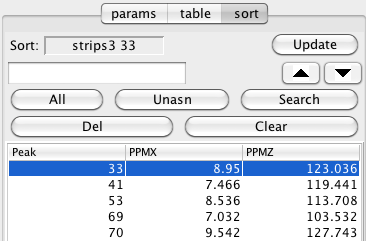
First choose a strip to check by clicking in the spectrum window for that strip and then click the Update button in the Sort section of the Strips tool. Now load a series of peaks into the Sort sections own peak table. You can click All, to add all peaks, Unasn, to add peaks that don't have assignments, or type in a series of peak numbers into the entry above the All button (click Enter to load them). All entries can be deleted by clicking Clear, and the selected row by clicking Del.
Now you can use the up/down arrows (below the Update button) to cycle through each entry in the list. As you move to a new entry, the value in the main Peak Table (of the Strips Tool) will be replaced with the new value, and the currently selected strip updated to show the strip at the positions of the new peak.