Canvas Windows
Canvas windows are display windows in which you can place graphical objects that can be as simple as lines and rectangles, or as complex as NMR spectra or charts. They can be used in a way completely analogously to spectrum display windows, where most of the display is taken up by a spectrum, and there is an iconbar across the top that gives access to spectral view controls. Or they can be simple blank canvases waiting for you to add any particular object.
When you display a spectrum on a canvas the spectrum is just another canvas object that can be positioned anywhere. That means you can create complex arrangements of spectra, not just in a simple grid as with the conventional spectral display windows. Spectral items can be positioned in any arbitrary size and location, including overlays that are exactly superimposed, or positioned as insets. Printing and exporting of canvases with multiple spectra is simpler than with conventional gridded spectral windows as well. With the normal spectral windows a grid is a whole series of "widgets" packed into a single frame, all of which have to be printed or exported in a correct arrangement to reproduce the display. With canvases, there is just one single canvas to print or export.
The simplest way to get a spectrum displayed in a canvas is to use Datasets Open Dataset in Canvas from the main menu. In many cases, however, one wants more control over how spectral windows are named, configured and arranged. For example, sometimes one wants to pack spectrum widgets inside of other windows, or create a matrix of spectra all packed together. Accordingly, spectral display windows can also be created either through the pop-up panels in the NMRViewJ GUI or through Tcl commands. The latter method allows for the creation of very complex arrangements of spectra in a way that can be used to facilitate a complex analysis method.
The NMRViewJ canvas window is just the Tk/Swank canvas widget, extended with additional display items. Because of this, the actual name for the canvas windows must conform to the hierarchical, dot-separated, naming scheme that is required of all Tk widgets. Both, the GUI interface for creating windows, and the NvMkSpectrum command hide this from the user. For example, if one uses either interface to create a window named noesy, a new toplevel window will be created named .noesy, and will contain within it a canvas widget named .noesy.0. The full name must be used when the windows are referred to using explicit Tcl commands. All items on a canvas are identified with integer canvas item numbers, and optionally with a tag. When a spectrum item is created, a low level Tcl command is also created that can give one access to properties of that particular spectrum. If you're creating a spectrum in a canvas named .win.canvas, and the spectrum's item number is "2", then the command will be "s.win.canvas.2".
Window names cannot start with capital letters, so attempting to create a window named "Noesy" will fail.
To create a new canvas that already contains one spectrum item, and has the spectrum tool bar across the top, choose <span class="menuchoice">Canvas > New > Spectrum from the main menu bar. A new toplevel window containing an icon bar at the top, a canvas in the middle, and a crosshair position bar at the bottom, will appear. The canvas will contain one graphical object, a spectrum.
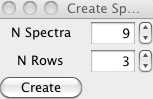
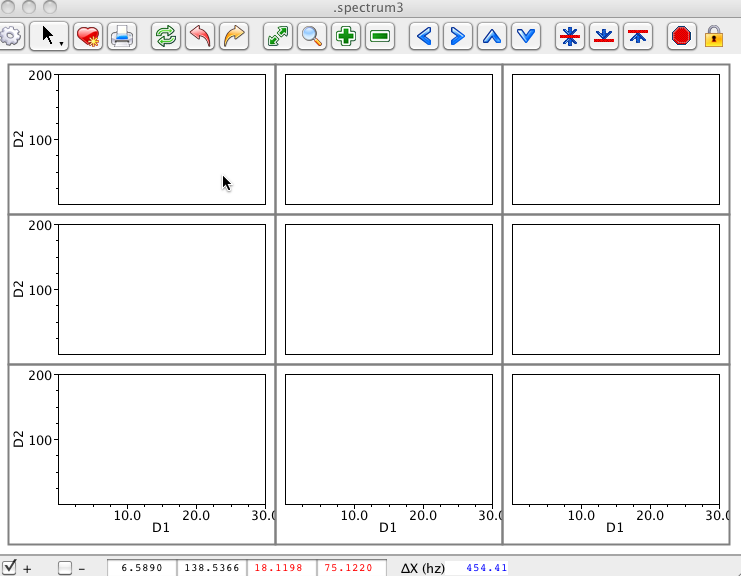
You can also create a toplevel window, with a canvas, and a grid of multiple spectra. Choose the menu item from the main menu. You'll get a dialog in which you can specify the total number of spectra items to be created and the number of rows they should be displayed in. Just select these values and click Create. Note that as you increment the N Spectra entry the N Rows entry will be automatically incremented to give you an appropriate number to give a nearly square grid of windows. But, you can change it to any value between one and the number of windows to be created.
The spectra, either one filling most of the window, or a grid of spectra will be created in fixed positions as with traditional grids of spectra. You can, however, unlock their positions, and drag them around to any location and size. See the section below on the Lock icon in the icon bar for details.
You can also create toplevel canvas windows that don't contain any spectra items. Just choose from the main menu bar and you'll get a toplevel window with a canvas. Note that when doing this the window will not include a spectrum icon bar at top, or crosshair status bar at bottom. It will, however, have a menu bar at top that includes the canvas menu, and a menu for controlling data fitting in case you add any charts.
Documentation coming.
Controlling the display of spectra in a canvas window is done exactly the same as with traditional NMRViewJ windows. The Spectrum Attributes window works with both traditional spectra and canvas spectra. Whichever window is "active" (recently clicked in) will be controlled. Please see the chapter Creating and Using Spectral Display Windows for details.
When creating a toplevel window with a canvas containing one or more spectra items, as described above, you'll find that an Icon Bar is present across the top of the window. These Icons provide easy access to commands to adjust the spectrum view and levels, as well as to print spectra and stop contour drawing that is in progress in a given window. Most icons work the same way as those in the traditional spectrum window icon bar, but there are a few differences to be aware of.
First, there are two additional icon buttons on canvas containing
windows for controlling the cursor mode and layout of spectra items. The
lock  button serves to
lock or unlock the positioning of spectra items on the canvas. If
locked, the spectra cannot be moved or resized (though any other canvas
items can). When unlocked they can be selected, moved, and resized.
Typically you'll want to leave them locked so you don't accidentally
move or resize them. Unlock them when you wish to adjust their layout,
adjust them, and then re-lock them.
button serves to
lock or unlock the positioning of spectra items on the canvas. If
locked, the spectra cannot be moved or resized (though any other canvas
items can). When unlocked they can be selected, moved, and resized.
Typically you'll want to leave them locked so you don't accidentally
move or resize them. Unlock them when you wish to adjust their layout,
adjust them, and then re-lock them.
The cursor  button serves gives easy access to
changing the mode of the cursor between Selector, Crosshair, Peak
Delete, and Peak Pick modes. The actual icon displayed will represent
the current mode.
button serves gives easy access to
changing the mode of the cursor between Selector, Crosshair, Peak
Delete, and Peak Pick modes. The actual icon displayed will represent
the current mode.
Actions induced by clicking on the icon bar buttons might apply to more than one spectrum item displayed in the canvas. The default is that actions like zooming in or out, or raising and lowering the contour level will apply to every spectrum item that is activated. All spectra items are normally activated when they are created, but may be deactivated by pressing the Esc key while the mouse cursor is over the item. Activated items will always have a gray border around the periphery of the item. Deactivated items will not respond to any actions from the icon bar or crosshairs, other than responding to a double-click of the left mouse button which will cause them to be activated.
The canvas can display a variety of items, including text, graphical shapes, annotation lines, charts, and spectra. Items are inserted by choosing an entry in the menu. The item will be added to the canvas in an arbitrary place. You can then move and resize it, as well as change various attributes such as its color.
Item types fall into categories of graphical objects, text, annotations, spectra and charts.
- Graphical Objects
Lines, Rectangles, Arcs and Ovals. Use the Graphical Inspector to alter attributes such as colors, stroke widths, arrows, and dash styles.
- Text
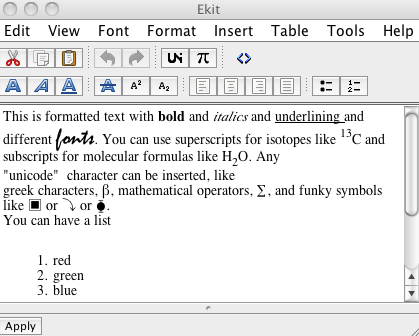
Text can be simple, formatted, or tabular. Simple text can be modified in which case you can change the actual text, the font and the color. Formatted text, can be modified by setting the attributes of individual characters to create complex formatted text, using various fonts, colors, bold, italic, superscripts and subscripts. You can also insert virtually any symbol. Text can also be inserted in a tabular form. Formatted text and tables are edited with a special editor that gives access to the various formatting attributes.
Formatted text and tables is actually created using HTML, the language of web pages, and the text editor is basically an HTML editor. It is basically WYSIWYG (what you see is what you get), but the advanced user might want to see and edit the actual HTML code. Double clicking on formatted text or tables will display the editor. Once you've created and formatted your text, click the Apply button at the bottom of the editor.
- Spectra
As discussed above, you can have one or more spectra. Use this insertion menu item to add an additional spectrum item to the canvas.
- Charts
You can insert one or more XY, bar, and statistical bar charts on a canvas. When inserted they will have some simple example data. We don't provide a graphical editor yet for the chart data, but you can use commands entered in the console to change the data and attributes of the charts. See the chapter on Charts for details.
- Text
In text mode you can edit the actual text to be displayed, the color of the text, its alignment, and the font used. This is obviously used for text items, but note that rectangles and ovals can have text displayed as part of the item as well.
- Attributes
Fill attributes apply to items such as rectangles, ovals, and arcs. Even spectra have a fill property. When using the spectrum attributes panel to change the spectrum background you are effecting the background of the entire canvas. You can change the fill property to change the fill of just a single spectrum on the canvas. Clicking the color chips for a fill, and either of the two color chips, for gradients will bring up a color editor. Colors can have varying levels of transparency, as selected in the color editor.
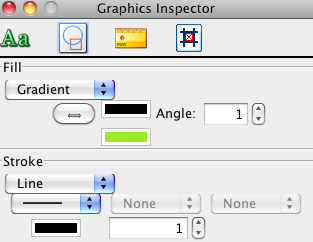
Stroke attributes affect the width, color, and dash style of lines (including the bordering line of filled shapes like rectangles), and the presence and type of arrow heads at either end.
- Geometry
The size and location of items on the canvas can be manipulated by selecting them and dragging the whole object to position them, or one of the handles that appear when selected to resize them. You can also use the controls in this dialog area to adjust the size and position.
Graphical items can be positioned and sized in three different coordinate spaces.
Pixels
In this default space, coordinates are expressed in pixel units of the graphical display with the origin of the coordinate system (0,0) being at the upper left corner of the canvas.
World
In this space, coordinates are expressed in units of a spectrum object. In particular, they will be in chemical shift (ppm) units of the object that is below them when they are switched to this coordinate system. Items using this space will then stay in the same chemical shift position no matter how the underlying spectrum is zoomed or panned.
Fraction
In this space, coordinates are expressed as fractions of the canvas size, so that the origin 0,0 is at the upper left corner, and 1,1 is at the lower right corner. Objects positioned in this system will take up the same relative portion of the canvas no matter how the canvas is resized.
You can switch items between the three coordinate systems by simply clicking on one of the three radio buttons in this geometry dialog. The actual position of the displayed item will not be changed, but the coordinates of the item will be transformed to give the same position on the canvas as it was in the previous coordinate space. Note that the values in the size and location spinboxes are always displayed in pixel units no matter what coordinate system the item is using.
- AnnoLines
Annotation lines are vertical, horizontal or diagonal lines that are drawn between crosshair lines. They are always drawn in world coordinates, that is chemical shift (ppm) space. Just position the crosshairs where you want on the spectrum and click the appropriate button on this dialog. The location of the simple lines is independent of the relative positioning of the black and red crosshairs. For example, if you click the button showing a vertical line on the left side, a line will be added to the spectrum along the left most vertical crosshair. The annotation line, with arrow and text is always drawn from the intersection of the two black crosshairs to the intersection of the two red crosshairs.
Canvas items are drawn in a certain order and those drawn later will appear over (in front of) items drawn earlier. You can select an item with the cursor and choose or to move them behind or in front of other items.
Spectrum items can be moved around into arbitrary positions on the canvas. You may wish, however, to arrange them in some organized fashion. You can arrange them in a series of equally spaced vertical or horizontal slices, or in a grid by choosing from the <span class="menuchoice">Canvas > Arrange Spectra menu.
An NMRView user may spend considerable time creating and configuring a canvas. Canvas windows can be saved to external files. NMRView has its own file format which stores all the information necessary to recreate the canvas window, with the exception of the actual datasets and peak lists. The names and locations of datasets will be saved in the file, so when reloading a canvas file NMRViewJ will attempt to locate the files necessary to recreate the file, or prompt the user to browse to them if necessary. Peak list information should be in memory, perhaps by loading a STAR file, before loading the canvas.
Canvas files are actually a Zip archive. The archive contains a file in XML format that describes the attributes of every item on the canvas, as well as the names of datasets and peak lists used. The canvas file also includes a thumbnail image of what the spectrum looks like, and a full resolution image of the canvas. These images are used in the NMRViewJ canvas file browser.
Canvas files can be saved by choosing the <span class="menuchoice">Canvas > File > Save... menu item. A file browser will pop-up and prompt for the location to save the file in. Files automatically get a ".dcxf" extension. Canvas files can be loaded by choosing the menu item. A file browser will pop-up and prompt for the location of the file to open.
NMRViewJ includes a canvas file browser, accessed via the <span class="menuchoice">Canvas > File > Browse... menu item. Since each file includes a thumbnail image of what the canvas looked like you can easily browse and choose your file visually. A file browser will pop-up and prompt for the directory to browse. Choose the directory that contains files, not individual files. The browser will appear and you can use the scrollbar at bottom to scroll through the available canvas files. Click the View button to pop up a full resolution image of the file so you can examine it in more detail, or the Open button to actually open the file.
Canvas files opened via Open... or Browse.. will displayed in a toplevel window whose name is chosen automatically (typically .spectrum1, .spectrum2 etc.) You can open the same canvas file multiple times, each time it will appear in a new window.