Tract Analysis
This tool performs analysis of effective rotational correlation times by use of TRACT analsyis as described in Lee et al. (2006), J. Magn Resonance 178:72-76
- Process the arrayed spectrum
-
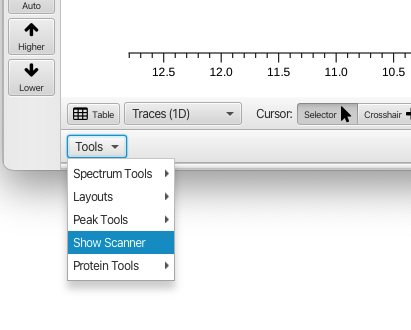
Open the Scanner tool
-
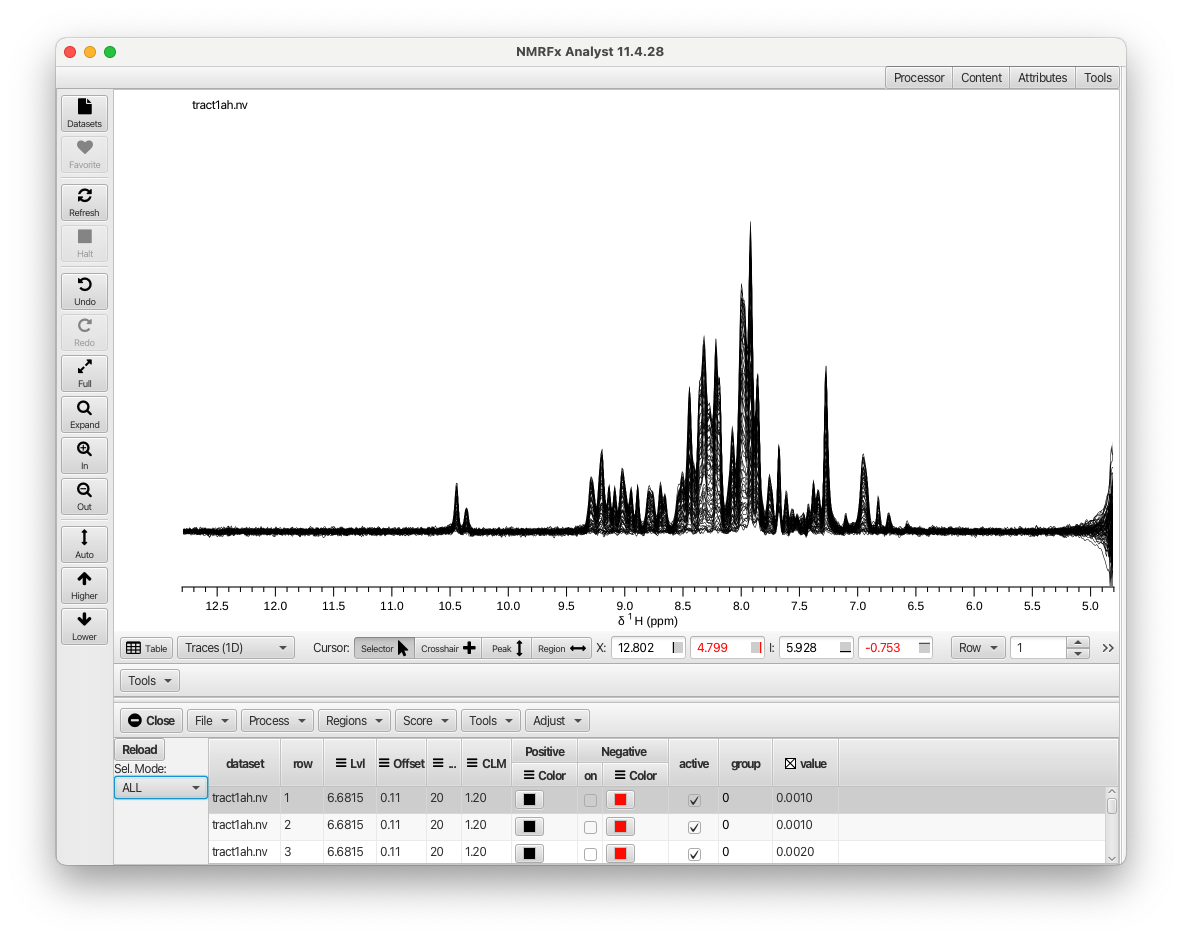
Use the table to adjust your view. Here the Mode is set to All so all rows of the spectrum are shown. You can use the Trace controls in the Attributes panel to adjust vertical offsets etc.
-
If your data is from a Bruker instrument and the data directory has a *vdlist* file it will have been read and the scanner table will have a values column corresponding to the relaxation delay times. Otherwise create a text file with the delay values on each row. You can use the Load Column* menu item from the Scanner Tools File menu to load that file in.
-
In crosshair region mode drag out a region of interest. You'll get a pop-up asking for a column nname and the integrals will be added to the table As an alternative to dragging out the region, you can ue the cursor in crosshair mode to position the vertical crosshairs around a region of interest and then use Add Crrosshair Region in the Region menu. You can extract integrals from multiple named regions and choose which ones to use in the analysis.
-
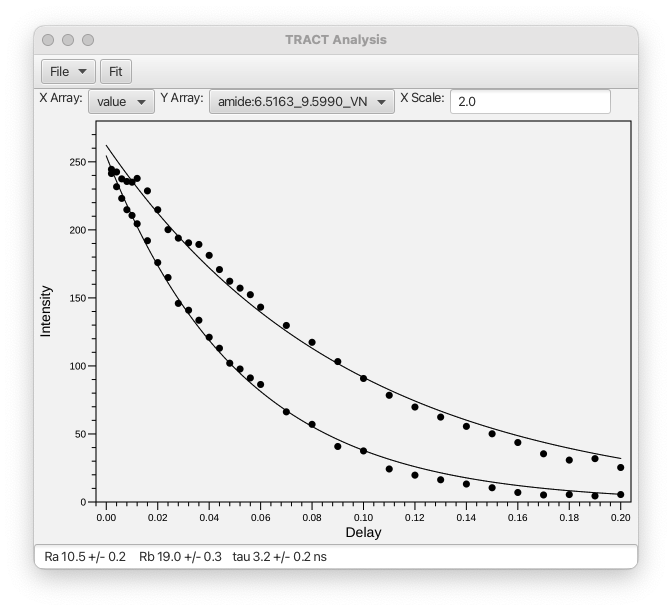
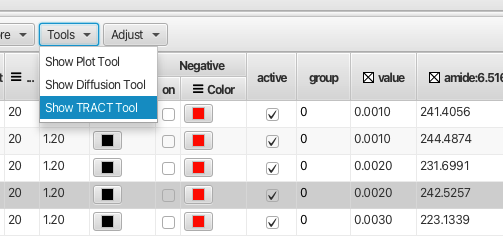
From the Tools Menu (in the Scanners tool bar), choose Show TRACT Tool". A plot tool will appear. Use the X Array and Y Array menus to select table columsn for the delay (X) and integrals (Y). Eter a value in the X Scale* entry to scale the delay values as needed. In this example a value of 2.0 is appropriate.
-
Click the Fit button to perform the fit. The status bar at the bottom of the plot will display the two relxation rates and the calculated tau value (with errors).